xByte Dashboard Overview
This article should serve as a guide for accessing your server dashboards and the features within them.
Accessing the Dashboard
-
To begin, you’ll need to log in to the billing control panel. Below is our Billing Control Panel URL.
Billing Control Panel: https://billing.xbytecloud.com/
-
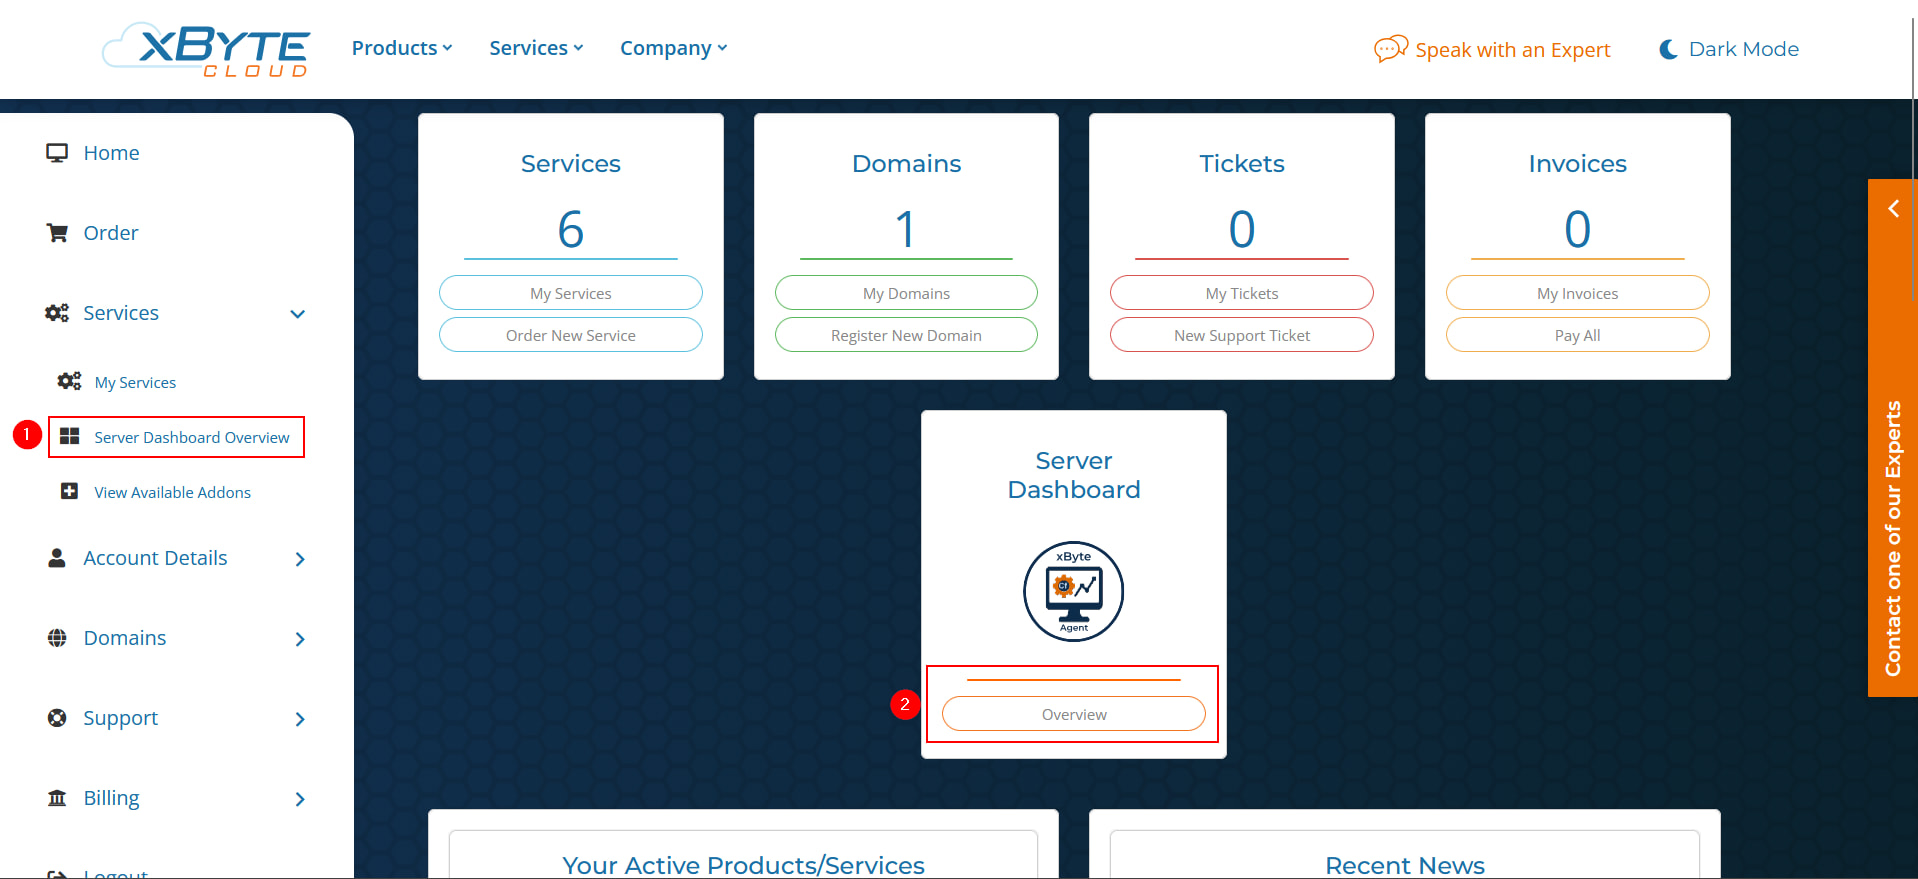
Select one of the options in the screenshot below to access the dashboard overview page.
-
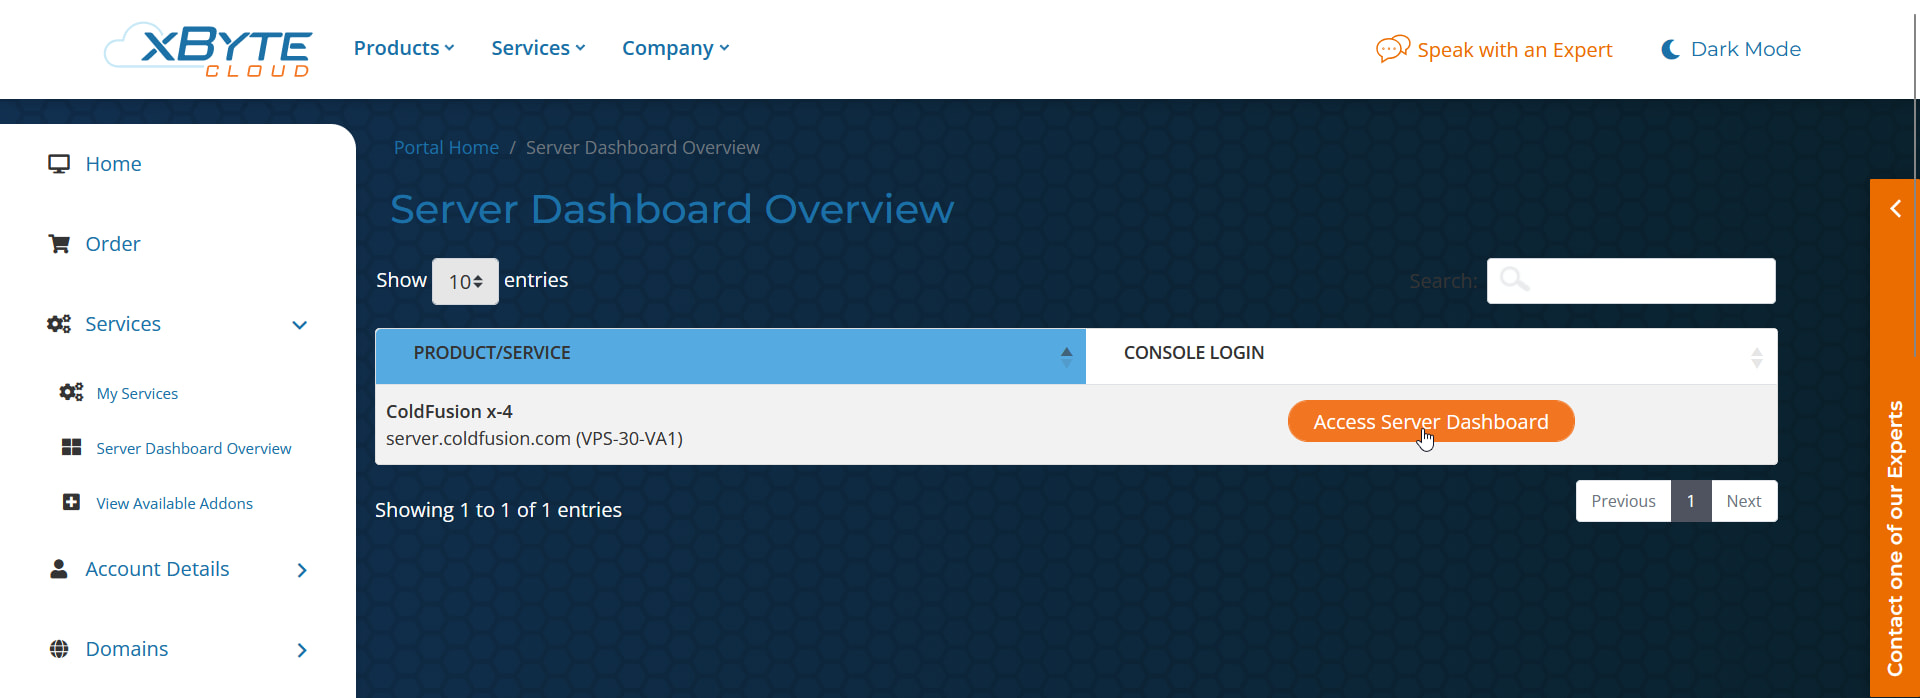
This page will present you with a list of your servers that have the dashboard enabled. Click the “Access Server Dashboard” button to view the dashboard for a server.
Overview of Features
Dashboard Navigation
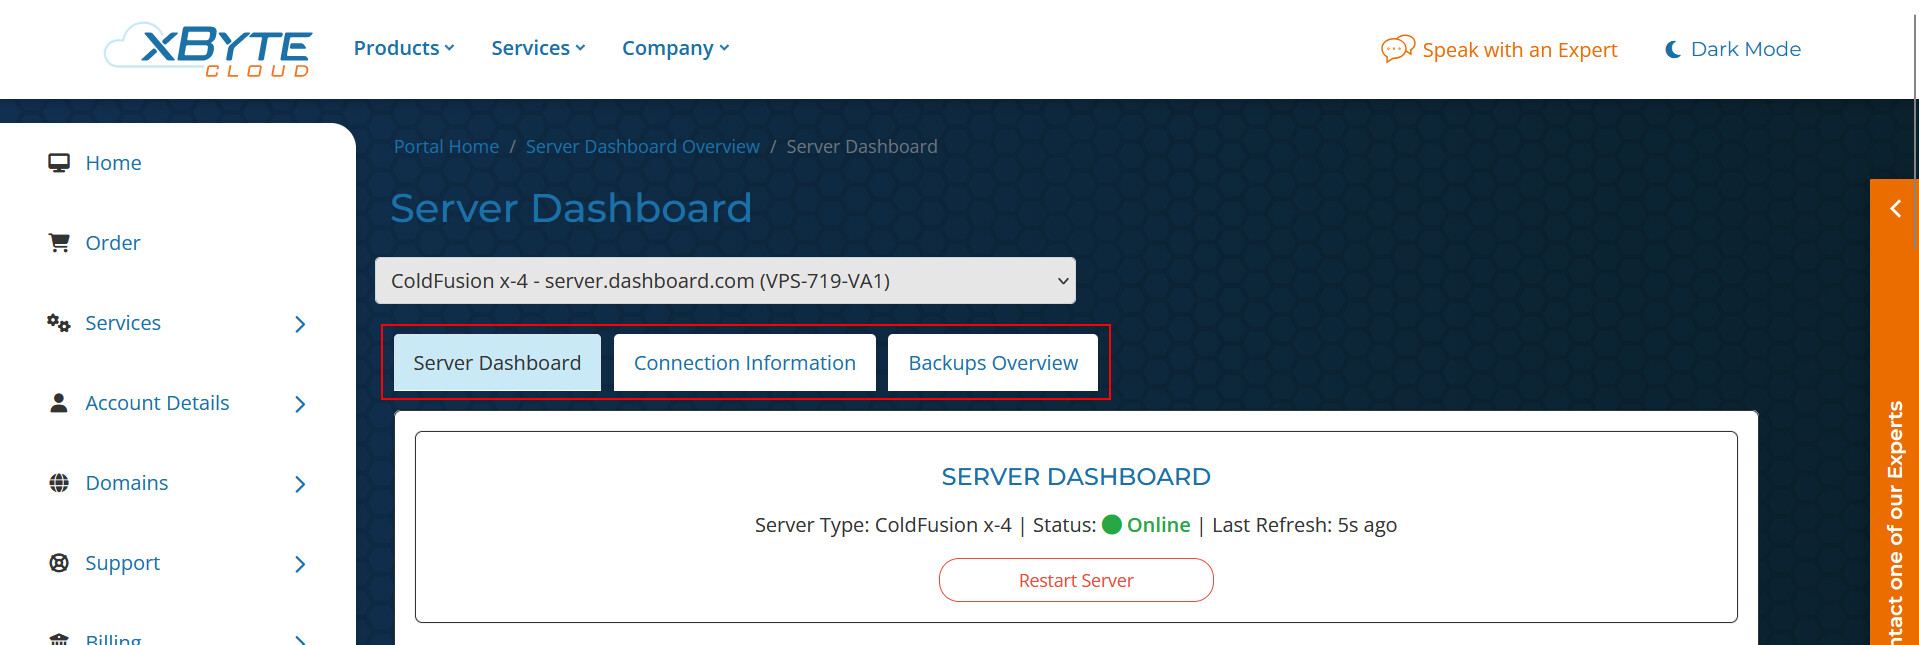
At the top of the dashboard, you’ll see 3 navigation options:
- Server Dashboard: The default page for restarting the server, scheduling and/or performing ColdFusion updates, and viewing resource usage.
- Connection Information: Used for viewing all of your server connection details (IPs, Credentials, etc.)
- Backups Overview: Used for viewing your currently retained backups and for requesting restores.
Server Dashboard Tab
Server Restart, Server Details, Resource Averages, and Threshold Alerts:
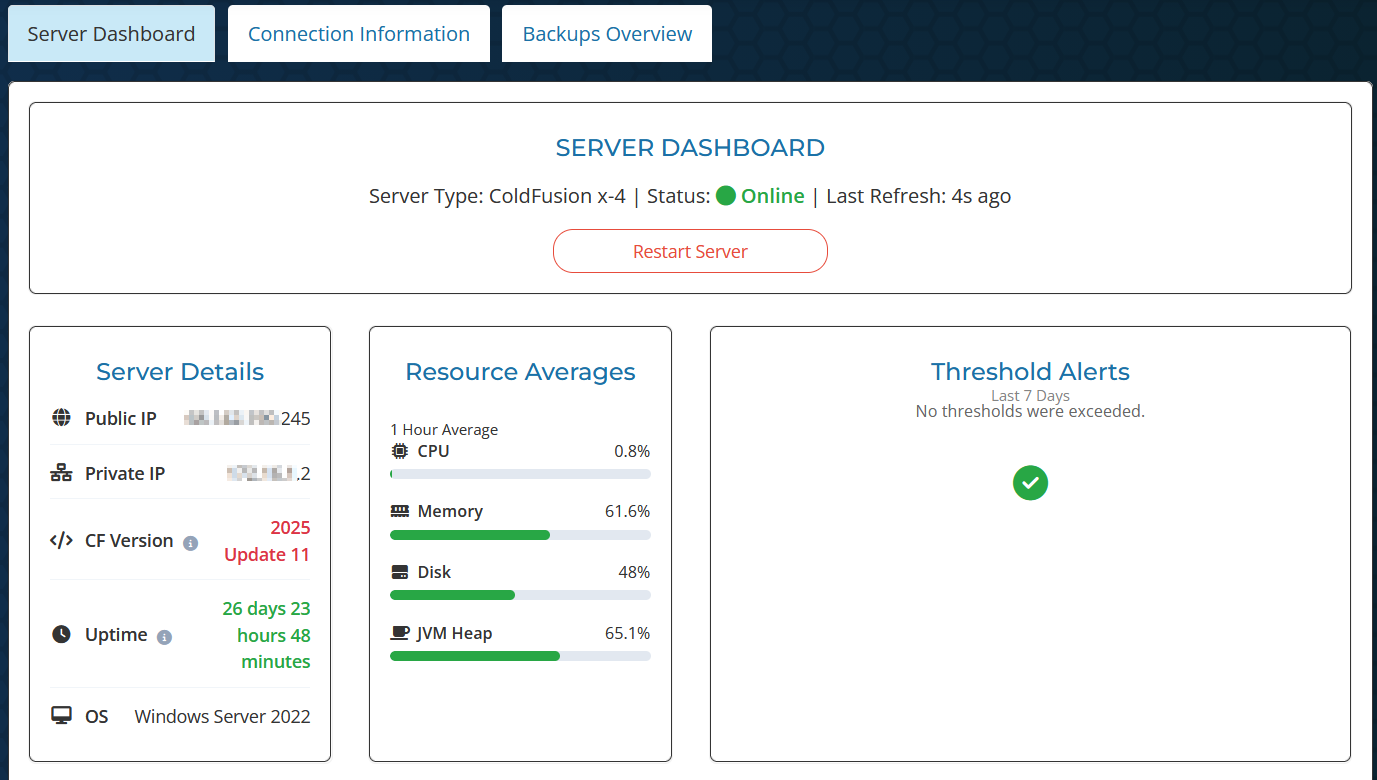
- Server Dashboard: You’ll see your server type, its status (Online or Offline), and the last time the status was refreshed. Clicking the “Restart Server” button will allow you to restart your server.
- Server Details: You’ll find your public and private IP (if you have one), the CF Version (if CF is installed), the server’s uptime, and the OS Version.
- Resource Averages: This will show your resource averages over the last selected time period. By default, this is 1 hour. This can be changed by using the “1H”, “6H”, “12H”, and “1D” buttons further down the page.
- Threshold Alerts: Threshold alerts will appear if your CPU/Memory/Disk usage exceeds the following metrics.
- CPU usage above 90% for more than 15 minutes.
- Memory usage above 95% for more than 15 minutes.
- Disk usage above 97% for more than 15 minutes.
ColdFusion Updates
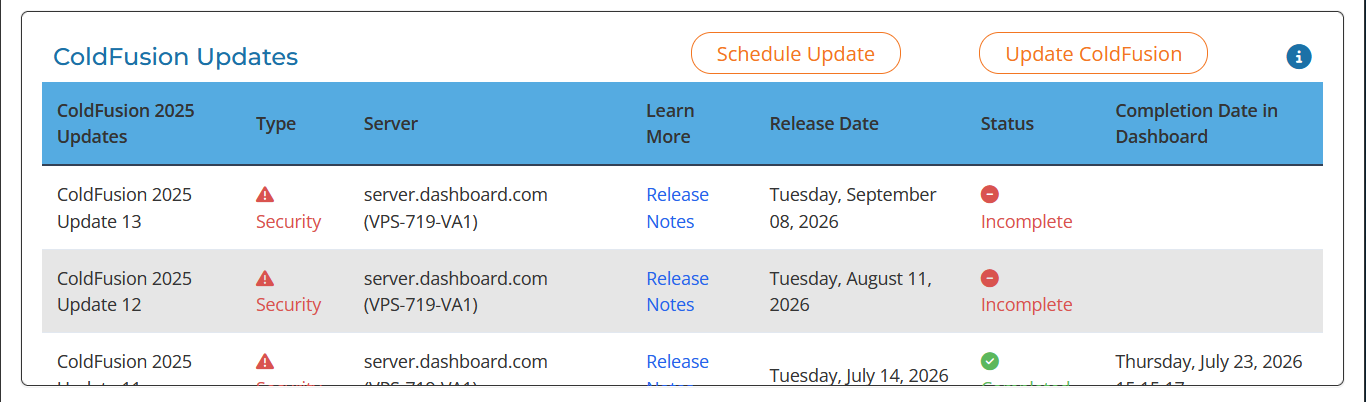
This section of the dashboard shows your ColdFusion servers’ update status. If any of the updates say “Incomplete,” like in our screenshot, then you can automatically perform the update using the “Update ColdFusion” button. Alternatively, you can schedule the update to be applied after hours using the “Schedule Update” button.
Resource Utilization
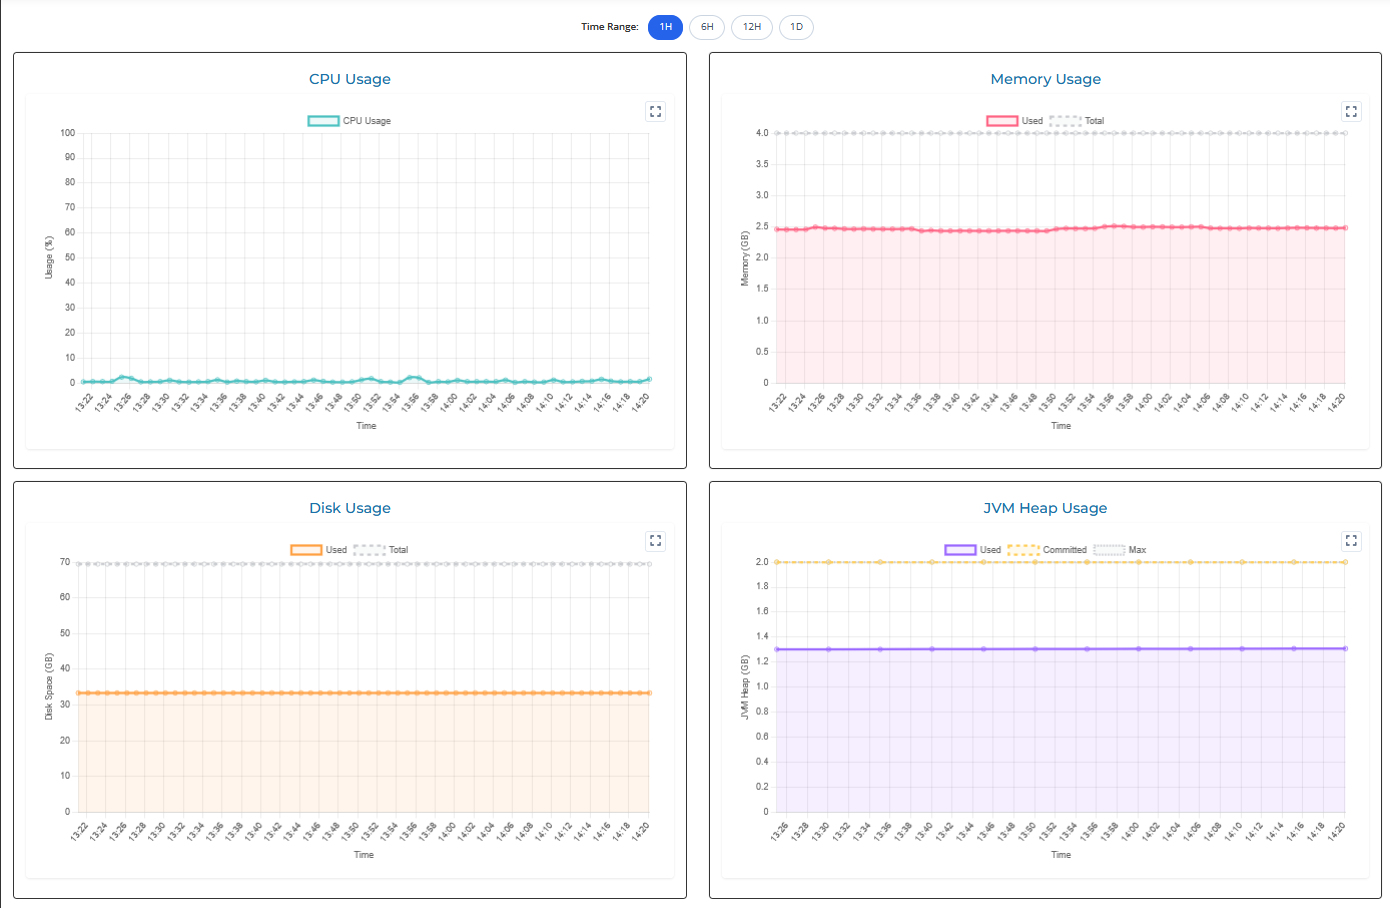
In this section, you can view the historical resource utilization of your servers. The “Time Range” buttons at the top allow you to increase or decrease the amount of data that’s visible.
Connection Information
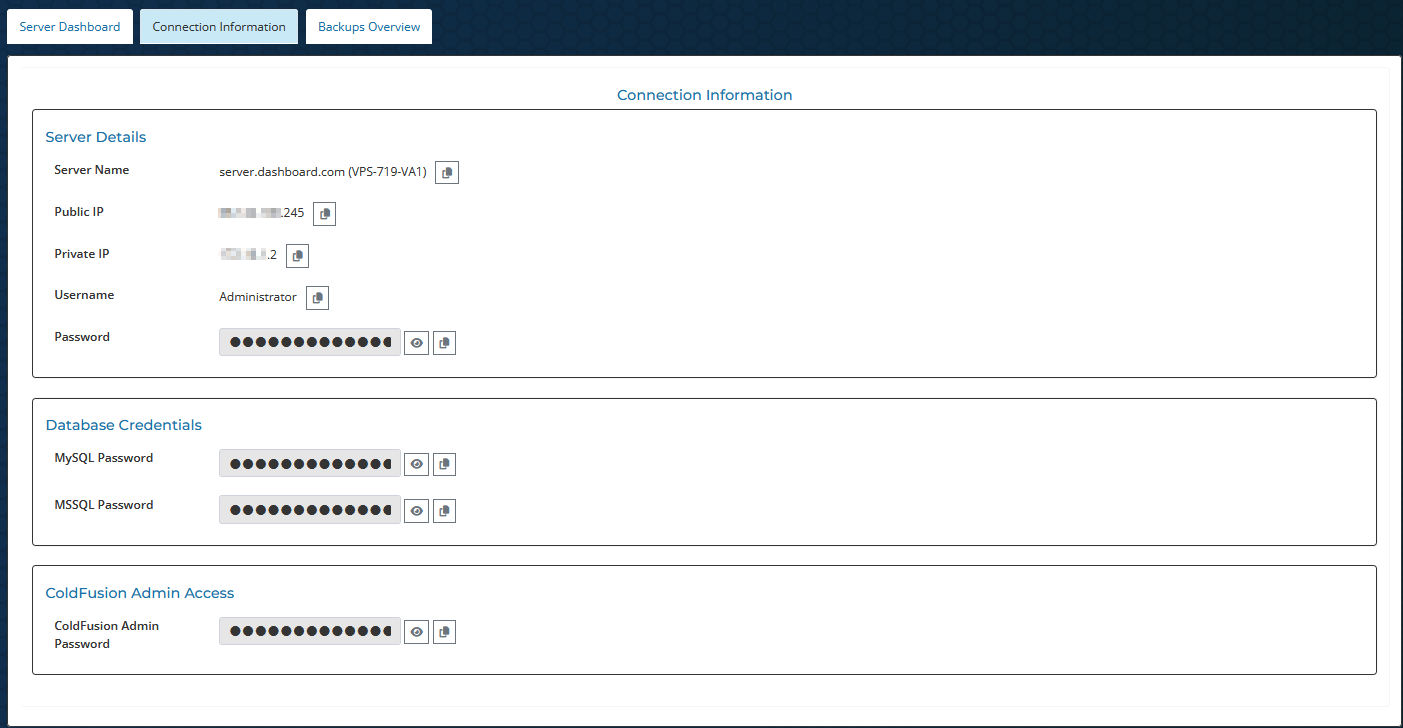
This tab will allow you to view your full server connection information, as well as usernames and passwords for the services on your server.
Backups Overview
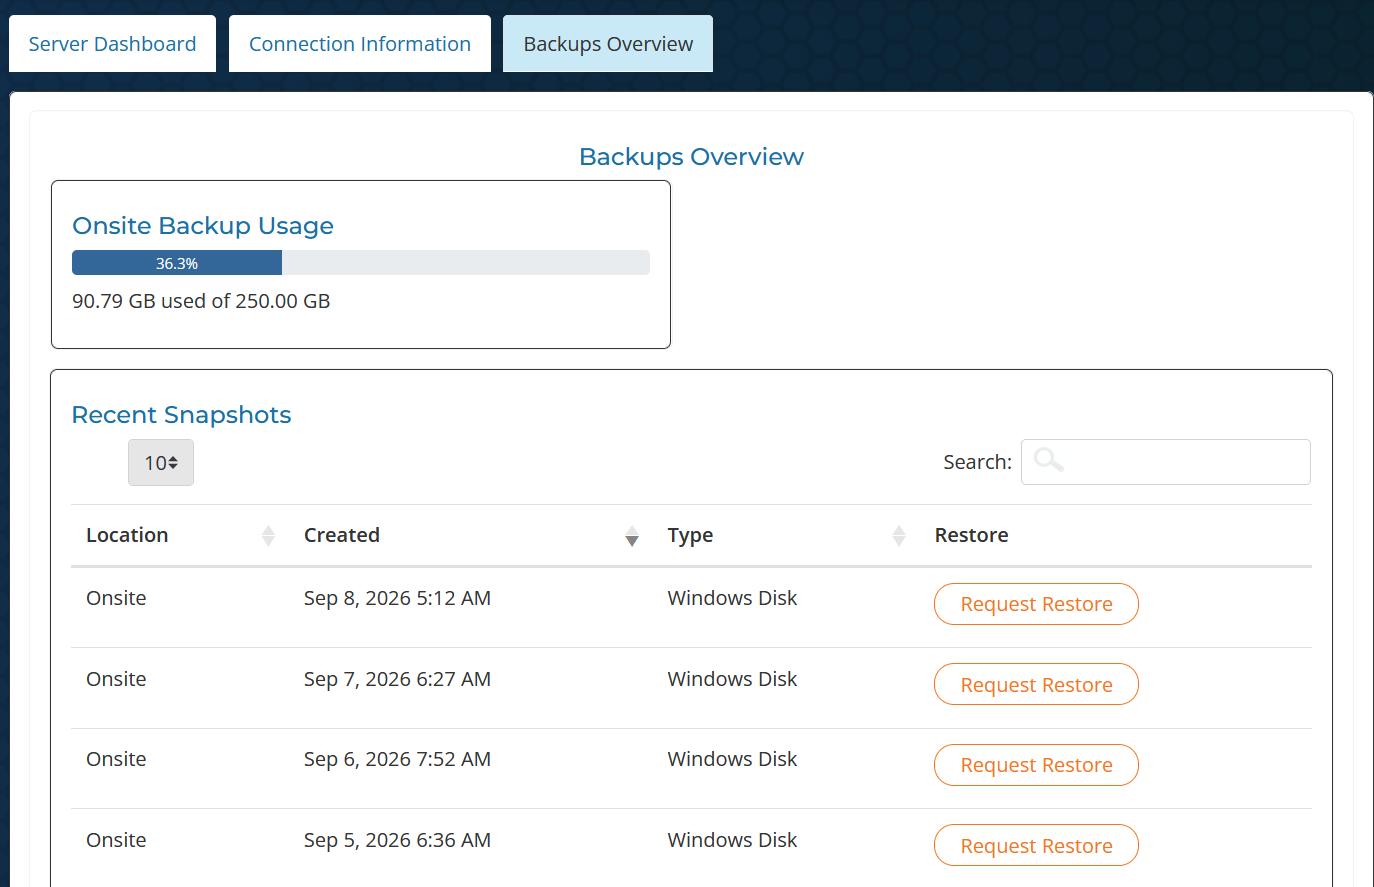
This final tab will show you how much space your backups are using, in comparison to your total backup space quota. You can also view the individual days that you have and request a restore using the “Request Restore” button.